
Plures Intelligens Modicum Machinatorem
808 Gilman Street Berkeley, CA 94710 | 510-549-3300 | admin@bearinc.com
Dr. Glen Stevick, P.E. ext. 101 | Dr. Dave Rondinone, P.E. ext. 102 | Derek King, P.E. ext. 103 | Mingxi Zheng, P.E. ext. 106 |
near surface stress analysis
Stress Analysis.
Stress Analysis is also known as Structural Analysis; it enables engineers to measure stress occurring in the components used in consumer products. Residual Stress Analysis is introduced into materials during the fabrication and surface treatment of materials, such as machining processes (grinding, milling), thermal processes (welding, casting), and cold working process (shot peening). Residual stress can be both beneficial and not. Shot peening creates beneficial compressive residual stresses into metal components, such as turbine engine blades, or into brittle materials, such as smartphone glass and concrete.
Residual stress toughens the materials and increases the lifetime of components. However, material components can prematurely fail when there is a high level or tensile residual stress in the material. Catastrophic failure of bridges, pressure vessels, and welded pipes are examples of the failure caused by residual stress. BEAR Engineers use a proven ultrasonic method (Refracted longitudinal wave measurements, high-precision slice method) to locate the area of residual stress in critical structural compartments and can check for possible failure from fatigue or crack propagation. By performing FEA (Finite Element Analysis) of the structural models, our engineers can also validate the residual stress distribution.
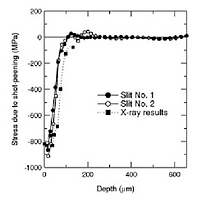
The illustration on the right demonstrates Bear's analysis, charting the experimental data of deep residual stress generated by shot peening at corresponding depths of materials.

The diagram to the left is of a valve compartment including heat treated surfaces (valve body) where residual stress analysis and measurement was performed.
through-thickness stress distribution
Through-thickness residual stress is created from fabrication and heat treatment processes. This is especially an issue in thicker parts since effects of things like heat or pressure are not uniformly applied through the section.
Examples of our stress analysis includes fillet and butt welds in the figure to the left. The right image is a diagram showing a water-quenched and cladded part with a strain gage attached to measure the effects of EDM cutting on a part. Understanding not only the effects themselves, but also how to accurately measure these effects are critical to stress analysis.
compliance & single-slice methods

Compliance method measures residual stress by cutting with a wire EDM to incrementally cut into a part while measuring the released strain, as shown in the diagram above. Single-slice method obtains the 2-D distribution of axial stress from the strain measurement while thin slice from mid-section of sample is removed.
The illustration to the left is an example of a stress measurement of the production component - the distribution of the axial stress of the component. The colors signify the how much stress is in each location: the redder areas are experiencing the highest amounts of stress while the blues are the lowest. Using diagrams like these can help show risky areas and identify a cause of failure.